There’s a certain restaurant near my home, with a menu that is a wire-bound book, chock-full of dozens of dishes from a wide variety of cuisines. The food is usually good, but I don’t go very often because the overwhelming menu makes ordering a chore. Navigating through such a vast selection leaves me feeling indecisive and overwhelmed. I often find myself gravitating toward the same few familiar dishes, missing out on the opportunity to discover new and exciting flavors. A smaller, more focused menu – approachable, interesting, and appetizing –would do a much better job guiding me to the perfect dish, making the experience far more enjoyable. The same philosophy holds true when it comes to getting marketing data insights from dashboards.
Just as a well-designed menu guides diners to the most appealing options, an effective dashboard should present key marketing data in a clear and concise manner, allowing users to quickly identify insights and make informed decisions. Let’s take a deeper look.
What you’ll learn:
Marketing data insights built on a dashboard foundation
In a good-faith effort to be everything to everyone, some dashboards are built to display nearly every conceivable metric, trend, and visualization. But this is a fool’s errand. A dashboard is valuable when a user can discover insights that lead to better decisions.
It’s important to understand the difference between insights and reporting. Reporting provides the “what” (or the data), while insights provide the “why” and the “so what”. Reporting is descriptive, while insights are actionable. Reporting is about looking at the past, while insights inform the future.
Let’s say your campaign is live, and you’re monitoring conversion rates. In your dashboard data, you see that social media ads are lagging significantly behind email. But more importantly, you can use this data to understand why this is happening and take quick action when it matters. Perhaps the email subject lines are more compelling or the landing page is better optimized. Armed with this real-time understanding, you can quickly adjust your social media ads in flight, mirroring the successful email elements, and see an immediate improvement in performance.
If your users are suffering with complicated dashboards, here’s how to turn your dashboards into a tool for insights.
Make better decisions with Marketing Intelligence
Learn how our next generation of marketing analytics can help you boost marketing impact, reduce budget waste, and improve margins. Here’s a sneak peek.


Build dashboards around user stories
User stories provide a concise way to define the business problem you need to solve, and the value that will result. A well-crafted user story follows this format:
As a [persona],
I need to [perform a task],
so that I can [take an action].
I’ll know this is done when [I have this result].
Consider this example story for a campaign manager who has a weekly marketing performance optimization (MPO) review with their media agency:
As a Campaign Manager (persona), I need to understand how my media is driving conversion across channels and creatives (task), so I can find underperformers that need to be investigated, and identify opportunities to shift my underperforming spend to better performing options, helping me hold my agency accountable (action). I’ll know this is done when I have a dashboard that helps me quickly identify where I can reallocate my spend to gain improved conversion (result).
Let’s break down how this four-step approach builds effective dashboards for better insights.
1. Persona: Tailor to a specific business user
The persona is essential. Dashboards designed with a broad, topical focus rather than specific user needs typically result in an overwhelming and unfocused view and little to no insights. Take MPO, for example. While the overall goal is to identify and address underperformance or reallocate spend from low-performing to high-performing media, the focus varies by role:
- Marketing executives optimize across brands and regions.
- Brand managers focus on campaigns and product categories.
- Campaign managers analyze channels and creatives.
These are all similar, but they’re not asking the same questions, and therefore would benefit from different insights. Trying to accommodate all these needs in one dashboard muddies the waters with irrelevant information, making it harder for each of these users to discern what’s going on, glean insights, and make better decisions.
2. Task: Design to aid daily work
Once you’ve defined your personas, work with your users within each persona to understand how they need to use data in their daily work, identify their key needs, and agree on what it looks like when you’re done.
By collaborating with your personas to build dashboards tailored to their specific tasks, you ensure dashboards are more than just metric displays; they become tools that empower users to excel in their roles. By allowing them to independently collect and analyze the data they need, these dashboards foster a deeper understanding of their work, driving faster, more informed actions without IT dependence.
3. Action: Identify the key questions to answer
To support their tasks, work with users to identify their essential questions and curate the most important ones that drive action. A great dashboard answers the key questions and then stimulates second– and third-order questions that drive deeper insights with real value. These questions could include:
- How well are my channels driving conversion?
- Is there certain creative that resonates better with my customers?
- Which campaigns are best at delivering traffic to my site?
- Which segments have the best Customer Acquisition Cost (CAC)?
Next, select the metrics that directly answer the key questions, prioritizing essential KPIs the clearly define success. For instance, a revenue-focused campaign might boil down to these metrics:
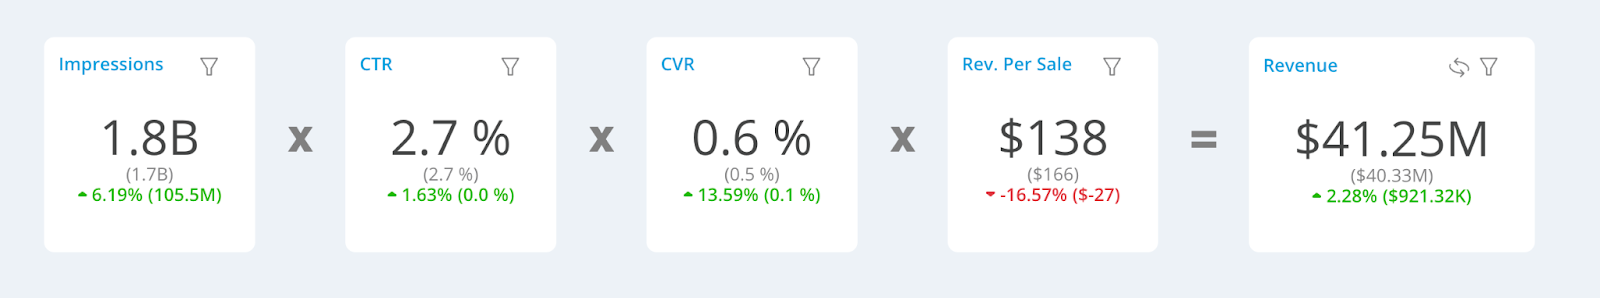
- Impressions: Measure ad volume.
- Click-through rate (CTR): Indicate ad effectiveness.
- Conversion rate (CVR): Show how well the site converts visitors.
- Revenue per sale: Reflect site merchandising effectiveness.
Together, these metrics provide a clear picture of revenue drivers. Use other metrics to add color and depth to your KPIs and to help guide the user toward the “why” behind each KPI. For example, to understand CVR, consider including site visits, time on site, number of page views, repeat visits, etc.
4. Result: Design dashboards for clarity and impact
Now you’ve armed yourself with the information you need to build your insight-driving dashboard. As you design it, consider these tips to make your dashboard more impactful:
- Use questions as chart titles. This ensures charts directly answer key questions and helps users quickly grasp their purpose.
- Link dashboards for depth: Keep dashboards lean by focusing on high-level insights. Provide links to detailed dashboards for users who need deeper analysis. This keeps each dashboard focused yet allows users to dig deeper when warranted.
- Pressure test each element: Make sure that everything on the dashboard helps guide the user toward insights that drive the desired results. Remove anything that doesn’t.
Let’s apply this four-step approach to the Marketing Executive persona. This user can use a dashboard to gain a holistic view of marketing performance across all brands and regions. By analyzing key metrics such as overall revenue, customer acquisition cost (CAC), customer lifetime value (CLTV), and brand awareness scores, executives can answer critical questions: “Which brands and regions are driving the most revenue and profitability?” “Where are the greatest opportunities for growth and expansion?” and “How effectively are marketing efforts translating into brand awareness and customer loyalty?”
For example, a consistently high CLTV for the ‘X’ brand in the ‘Y’ region might indicate a strong market fit, prompting further investment and expansion strategies in similar regions. This data-driven approach allows executives to make informed decisions about resource allocation and overall marketing strategy.
By following this approach, you’ll transform dashboards from cluttered data dumps into trusted tools that drive insights and yield improved decision-making. Focus on personas, simplify the experience, answer key questions, and prioritize clarity over quantity. The result? Better insights in less time, leading to improved decisions and increased business value.
What can you do with digital marketing analytics?
Connect and analyze your data with a single source of truth for marketing performance.